List PR (Norway)
A Legislative Power Share score can be computed in a similar fashion for voters who use proportional voting systems. We first consider the situation of a country such as Norway that uses a List Proportional Representation system. In a standard List PR system, voters are divided into regions (in Norway’s case, these are called counties). Political parties put forward lists of candidates, and voters typically select a list or a candidate on a list. The number of candidates elected from each list is determined by the country’s specific electoral formula. Each party normally receives a number of seats that is approximately proportional to the number of votes cast for their list or the candidates on their list.
LPS for Simple Lists
Once the elected candidates are identified, we can calculate the LPS scores for the voters using a slight generalization of the process described above for First Past the Post elections.
-
As before, we calculate a national quota, Q = V/S, where V here represents the total number of votes cast nationally and S is the total number of seats in the legislature.
-
In a particular region i, we calculate a local relative influence value for voters who voted for a particular party j as Iij = (Vti/Si)/(Vij/Sij), where Vti = the total number of votes cast in region i, Si = the total number of seats in region i, Vij = the number of votes cast for party j in region i, and Sij = the number of seats won by party j in region i. For example, if a party receives 120,000 votes out of 200,000 cast and wins 2 of 4 seats available, then the local relative influence of the voters who supported that party will be I = (200,000/4)/(120,000/2) = 0.83, or 5/6ths of the influence voters would have if all their votes had equal influence on the makeup of parliament.
-
As with FPTP, we then apply a weighting factor, Wi, to that region to reflect any deviation from the average regional quota. We define Wi as Wi = Q/(Vti/Si). In the example above, if the national quota Q = 50,000 votes per seat, then Wi = 50,000/(200,000/4) = 1.0, which reflects the fact that voters in that region have the average number of voters per seat. If there were fewer voters in that region (i.e., if Vti were lower), then that region would have comparatively greater legislative influence.
-
Finally, as before, we multiply these two factors together to calculate the LPS score in region i for those voters who voted for party j: LPSij = Iij * Wi. In the example above, we would say that the 120,000 voters who voted for party j would have a Legislative Power Share of 0.83 x 1.0 = 0.83, or 5/6ths as much influence as parity would warrant.
Modification for Compensatory Seats
Norway’s voting system is slightly more involved than a standard List PR system, as it provides both list seats and compensatory seats. The Norwegian legislature has 169 seats, 150 of which are allocated from 19 regional (county) lists as described above, and 19 of which (one per county) are assigned to compensate for any overall imbalances that arise from the original regional allocations. For example, suppose a party wins 25% of the vote nationally. They would be entitled to 42 seats in total. If that party won 40 seats in the regional allocation of the first 150 seats, then they would be entitled to two of the 19 compensatory seats. The Norwegian system has an allocation process that they use to fill these compensatory seats, the details of which need not concern us. However, once the allocation has been done, we can calculate the LPS scores for all voters. To do this, we slightly modify the process outlined above.
First, we consider a voter to receive a share of legislative power if they did either or both of the following:
- Voted for a party that elected one or more representatives from the voter’s regional list, or
- Voted for a party that received a compensatory seat.
There are therefore three situations to consider:
-
Voters who derive their LPS solely from representatives elected from the regional list. For this situation, we use the process described above in “LPS for Simple Lists”. For example, in the 2017 Norwegian election, there were 2.93 million votes cast and 169 representatives elected, for an average of 17,319 votes per seat. In County #1, the Labour Party won three seats with 51,545 votes, or 17,182 votes/seat. The Legislative Power Share calculated for these voters is therefore 17,319/17,182 = 100.8%, or essentially at parity.
-
Voters who derive their LPS solely from compensatory seats. For a voter in this situation, we assign them a Legislative Power Share in essentially the same way as for the first situation, except that we calculate the votes/seat for the number of compensatory seats rather than for region. For example, in the 2017 election, the Centre Party won 18 seats in the counties, but their share of the national vote entitled them to 19 seats, so they were awarded one compensatory seat. There were 28,482 voters in four counties where no Centre Party candidate won a list seat, so we regard these voters as collectively sharing representation by the compensatory candidate. The Legislative Power Share calculated for these voters is therefore 17,319/28,482 = 60.8%.
-
Voters who derive their LPS from a combination of regional and compensatory seats. In these situations, a voter will have voted for a party that won one or more regional list seats in the region in which the voter resides and was also awarded one or more compensatory seats. For example, in the 2017 election, the Conservative Party won 5 regional seats in County 2, and was also awarded three compensatory seats. We regard such voters as having received a first share of Legislative Power through the regional list representatives, and their LPS score is initially calculated based solely on the five regional representatives as described above in section 1. In this example, the 104,451 Conservative voters in County 2 had a relatively low LPS score of 83% (in contrast, Conservative voters in County 17 had a relatively high LPS score of 169%).
To calculate the total Legislative Power Share scores for voters such as those in County 2, we start by calculating the LPS for any voters who voted for a party but did not see any local representatives elected from that party. In this example from the 2017 election, only the 5600 Conservative voters in County 20 did not see a Conservative Party representative elected in their local region. We therefore initially presume that these 5600 voters are represented by the compensatory representatives and calculate a provisional LPS score (here, it would be equal to 17,139/(5600/3) = 918%, or over 9 times an equitable level.
However, the Conservative voters in County 2 had an original LPS score of only 83%. This was the lowest value across all the counties that elected at least one Conservative representative from the regional list. Because this score is lower than that calculated for the Conservative voters in County 20, we consider that these voters would also share in the representation provided by the compensatory candidate, so we recalculate the total LPS for the Conservative voters in Counties 2 and 20 combined. This results in an updated LPS score of 17,139/((104,451+5600)/(5+3)) = 125%.
We then check the remaining regions and identify the group of Conservative voters with the next lowest initial LPS scores in order to determine if those initial scores are lower than the updated value of 125%. There were 41,011 such voters in County 6 who had an initial LPS score of 84.5% for the two representatives elected from that county’s regional list. Since 84.5% is less than 125%, we include these voters in the pool of voters who derive some representation from the compensatory representatives and repeat the LPS calculation. This leads to a revised LPS score for this expanded group of voters of 17,139/((41,011+104,451+5600)/(2+5+3)) = 113%.
We repeat this process until the revised LPS score drops to a level where there are no remaining groups of voters with an initial LPS score based on the regional results lower than the LPS for the expanded group of voters deriving some representation from the compensatory candidates. In this example, voters from a total of 11 counties ended up deriving some representation from the compensatory candidates, and their collective LPS score ended up being 98.8%.
Finally, for each voter, we can calculate the difference between their final and initial LPS scores; this difference represents the amount of legislative power that they derive from the compensatory representatives. We refer to this power as indirect representation, since the voters did not directly vote for the compensatory candidates. Rather, these candidates were elected indirectly due to the aggregation of national party list votes received in each region.
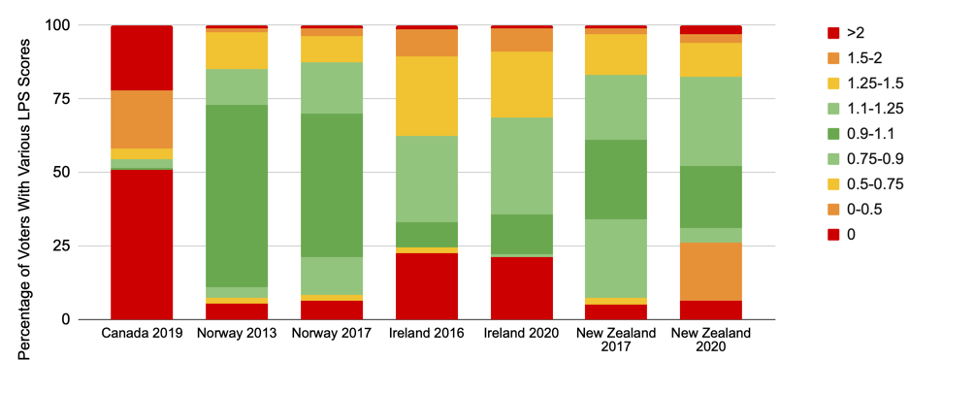
Graphing the results, as we did for FPTP’s Legislative Power Scores, yields the second and third columns in the following chart: